Risk of COVID-19 to people of different ages
Coronavirus disease 2019 (COVID-19) poses a risk of infection and death to people of all ages. Data reported shows that the mortality of patients with COVID-19 increases with age. Data reported in South Korea, Spain and Italy indicates that more than 92% of deaths are concentrated in patients over 60 years of age. Less than 1% of total deaths are under age 30. It is worth noting that the proportion of deaths in the age group of over age 70 reported by China is significantly lower than the proportion reported by Korea, Spain and Italy for the same age group. See Chart 1.
The risk of infection in different age groups reported in Italy and Spain is different from the risk reported in South Korea and China. Data from Spain and Italy indicates that the risk of infection increases with age. But data from South Korea indicates that the risk is more evenly distributed across all ages. China's data indicates that patients are more concentrated in the 30-69 age group. See Chart 2. The reason for this difference could be that in addition to different age distributions, test coverage of COVID-19 and even the definition of the diagnosis could be different in different countries.
In the following analysis, the data used for South Korea and Spain are reported as of April 11, 2020 and April 9, 2020 respectively. Data for Italy is based on the 94,088 cases reported April 9, 2020. China's data is based on 44,672 cases reported as of February 11, 2020.
1. Death rate and age
The trend in reported patient mortality in the four countries is very consistent; namely, the risk of patient death increases with age. Data reported in South Korea, Spain, and Italy indicated that 90%–96% of deaths from COVID-19 patients were over the age of 60. Data previously reported in China (44,672 cases) indicated that for the same age group (over 60), the deaths made up 81% of total patient deaths.
South Korea: 10,450 cases, 208 deaths.
| Age | Deaths | % of Total Deaths | |
|---|---|---|---|
| Above 60 | 191 | 91.83 | |
| 30–59 | 17 | 8.17% | |
| 0–29 | 0 | 0.00% | |
| Data as of April 11, 2020 [1]. | |||
Spain: 109,146 cases, 7,106 deaths.
| Age | Deaths | % of Total Deaths | |
|---|---|---|---|
| Above 60 | 10,853 | 97.23% | |
| 30–59 | 296 | 2.65% | |
| 0–29 | 13 | 0.12% | |
| Data as of April 9, 2020 [2]. | |||
Italy: 94,312 cases, 10,026 deaths.
| Age | Deaths | % of Total Deaths | |
|---|---|---|---|
| Above 60 | 9,541 | 95.21% | |
| 30–59 | 478 | 4.77% | |
| 0–29 | 2 | 0.02% | |
| Data as of March 30, 2020 [3]. | |||
China: 44,672 cases, 1,023 deaths.
| Age | Deaths | % of Total Deaths | |
|---|---|---|---|
| Above 60 | 829 | 81.04% | |
| 30–59 | 186 | 18.18% | |
| 0–29 | 8 | 0.78% | |
| Data as of 2020年2月11日 [4]. | |||
New York: 5,489 deaths.
| Age | Deaths | % of Total Deaths | |
|---|---|---|---|
| Above 60 | 4,522 | 82.43% | |
| 30–59 | 932 | 16.99% | |
| 0–29 | 32 | 0.58% | |
| Data as of April 6, 2020 [8]. | |||
2. COVID-19 death rate vs. normal annual death rate
The risk of dying from COVID-19 increases with age and health conditions. This trend is not different from the normal annual risk of death in the general population. As shown in a study by the University of Cambridge, nearly 10% of people over 80 will die in the next year, and the risk of them dying if infected with COVID-19 is almost exactly the same. The risk profiles in other age groups are similar. For people aged under 20 years, the COVID-19 death rate is lower than the normal death rate.
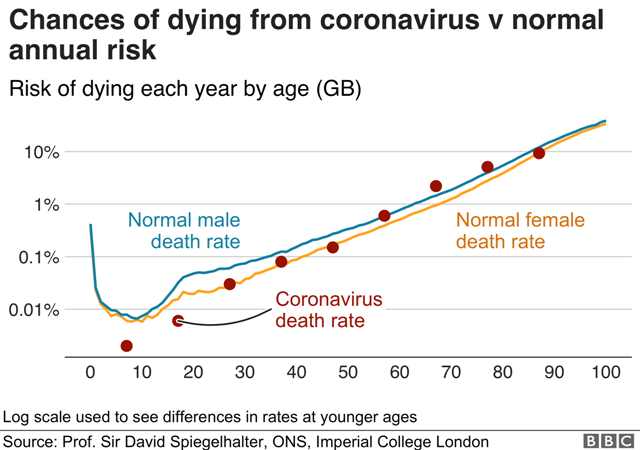
Source: [9].
The above study was based on the statistics of COVID-19 deaths in UK. Data from South Korea, Italy, Spain, and China showed that the COVID-19 death rate for people above 80 were between 20% and 30% (Table 1 - Table 4).
3. Infection rate and age
The rates of COVID-19 infections in different age groups reported in Spain and Italy are not entirely consistent with those reported in South Korea and China. Data from Spain and Italy indicates that the risk of infection increases with age. However, data from South Korea indicates that the risk of developing the disease is more evenly distributed across all ages. Data from China indicates that patients are mostly concentrated in the 30-59 age group. There are two reasons that could explain this difference. First, the four countries have different aging populations. For example, the population over 65 in South Korea is 13.2% of the population [1a]. In Spain, people over 65 comprisesis 17.9% of the population [2a], while in Italy the percent proportion of over 65 is 20% [3a]. It is worth noting that the population over 65 in China is 10.5% [4a], the lowest among the four countries. The second possible reason is that more extensive testing has been performed in South Korea [2020 coronavirus pandemic in South Korea]. As of March 24, 2020, approximately 348,582 people have been tested for the virus in South Korea and 9,037 have been positively diagnosed. The ratio of the number of tested to the number of confirmed patients was 38.5. The large number of tests might have allowed more young people with mild conditions to be detected and included in the statistics. In comparison, as of March 27, 2020, approximately 394,079 people had been tested in Italy, of whom 86,498 were confirmed positive. The ratio of the number of tested to the number of confirmed patients was 4.5. Also as of March 27, 2020, approximately 350,000 people in Spain have been tested for the virus, of whom 64,059 were diagnosed. The ratio of tested people to the confirmed patients was 5.5.
COVID-19 tests and diagnoses
| Country | Tests | Confirmed Cases | Ratio | Date & Source |
|---|---|---|---|---|
| S Korea | 348,582 | 9,037 | 38.5 | Mar 24, 2020 [1] |
| Spain | 350,000 | 64,059 | 5.5 | Mar 27, 2020 [2] |
| Italy | 394,079 | 86,498 | 4.5 | Mar 27, 2020 [3] |
| U.S. | 1,951,044 | 364,058 | 5.3 | Apr 7, 2020 [5] |
| Japan | 46,869 | 2,617 | 18.9 | Apr 3, 2020 [6] |
COVID-19 cases in 3 age groups
S. Korea: Total 10,450 cases.
| Age | Cases | % of All Cases | |
|---|---|---|---|
| Above 60 | 2,488 | 23.81% | |
| 30–59 | 4,429 | 42.38% | |
| 0–29 | 3,533 | 33.81% | |
Spain: Total 109,146 cases.
| Age | Cases | % of All Cases | |
|---|---|---|---|
| Above 60 | 55,477 | 50.83% | |
| 30–59 | 55,477 | 43.35% | |
| 0–29 | 55,477 | 5.83% | |
Italy: Total 94,312 cases.
| Age | Cases | % of All Cases | |
|---|---|---|---|
| Above 60 | 51,618 | 54.86% | |
| 30–59 | 37,285 | 39.63% | |
| 0–29 | 5,185 | 5.51% | |
China: Total 44,672 cases.
| Age | Cases | % of All Cases | |
|---|---|---|---|
| Above 60 | 13,909 | 31.14% | |
| 30–59 | 26,179 | 58.60% | |
| 0–29 | 4,584 | 10.26% | |
Table 1. Covid-19 death and infection rates in South Korea (9 age groups)
Data and statistics are based on the 10,450 cases reported in Korea as of April 11, 2020.
| Age | Cases | % of total cases | Deaths | % of total deaths |
% of death in age group |
|---|---|---|---|---|---|
| All ages | 10,450 | 100% | 208 | 100% | |
| Above 80 | 474 | 4.54% | 101 | 48.56% | 21.31% |
| 70–79 | 694 | 6.64% | 62 | 29.81% | 8.93% |
| 60–69 | 1,320 | 12.63% | 28 | 13.46% | 2.12% |
| 50–59 | 1,920 | 18.37% | 13 | 6.25% | 0.68% |
| 40–49 | 1,396 | 13.36% | 3 | 1.44% | 0.21% |
| 30–39 | 1,113 | 10.65% | 1 | 0.48% | 0.09% |
| 20–29 | 2,851 | 27.28% | 0 | 0.00% | -% |
| 10–19 | 553 | 5.29% | 0 | 0.00% | -% |
| 0–9 | 129 | 1.23% | 0 | 0.00% | -% |
| Source [1] | |||||
Table 1A. Covid-19 death and infection rates in South Korea (3 age groups)
| Age | Cases | % of total cases | Deaths | % of total deaths |
|---|---|---|---|---|
| All ages | 10,450 | 100% | 208 | 100% |
| Above 60 | 2,488 | 23.81% | 191 | 91.83% |
| 30–59 | 4,429 | 42.38% | 17 | 8.17% |
| 0–29 | 3,533 | 33.81% | 0 | 0.00% |
Table 2. Covid-19 death and infection rates in Spain (10 age groups)
Data and statistics are based on the 109,146 cases reported in Spain as of April 9, 2020.
| Age | Cases | % of total cases | Deaths | % of total deaths |
% of death in age group |
|---|---|---|---|---|---|
| All ages | 109,146 | 100.0% | 7,106 | 100.0% | |
| Above 90 | 5,346 | 4.9% | 1,290 | 18.2% | 24.1% |
| 80-89 | 14,739 | 13.5% | 3,035 | 42.7% | 20.6% |
| 70-79 | 17,297 | 15.8% | 1,848 | 26.0% | 10.7% |
| 60-69 | 18,095 | 16.6% | 624 | 8.8% | 3.4% |
| 50-59 | 20,342 | 18.6% | 206 | 2.9% | 1.0% |
| 40-49 | 16,451 | 15.1% | 66 | 0.9% | 0.4% |
| 30-39 | 10,518 | 9.6% | 24 | 0.3% | 0.2% |
| 20-29 | 5,477 | 5.0% | 11 | 0.2% | 0.2% |
| 10-19 | 593 | 0.5% | 1 | 0.0% | 0.2% |
| 0-9 | 288 | 0.3% | 1 | 0.0% | 0.3% |
| Source [2] | |||||
Table 2A. Covid-19 death and infection rates in Spain (3 age groups)
| Age | Cases | % of total cases | Deaths | % of total deaths |
|---|---|---|---|---|
| All ages | 109,146 | 100.0% | 7,106 | 100.0% |
| Above 60 | 55,477 | 50.83% | 10,853 | 97.23% |
| 30–59 | 47,311 | 43.35% | 296 | 2.65% |
| 0–29 | 6,358 | 5.83% | 13 | 0.12% |
Table 3. Covid-19 death and infection rates in Italy (10 age groups)
Data of infections and deaths is based on the 94,088 cases reported by Italy as of March 30, 2020.
| Age | Cases | % of total cases | Deaths | % of total deaths |
% of death in age group |
|---|---|---|---|---|---|
| All ages | 94,312 | 100.0% | 10,026 | 100.0% | |
| Above 90 | 3,573 | 3.8% | 939 | 9.4% | 26.3% |
| 80–89 | 14,186 | 15.0% | 3,984 | 39.7% | 28.1% |
| 70–79 | 17,464 | 18.5% | 3,456 | 34.5% | 19.8% |
| 60–69 | 16,395 | 17.4% | 1,162 | 11.6% | 7.1% |
| 50–59 | 18,678 | 19.8% | 369 | 3.7% | 2.0% |
| 40–49 | 12,084 | 12.8% | 89 | 0.9% | 0.7% |
| 30–39 | 6,523 | 6.9% | 20 | 0.2% | 0.3% |
| 20–29 | 3,830 | 4.1% | 2 | 0.0% | 0.1% |
| 10–19 | 766 | 0.8% | 0 | 0.0% | 0.0% |
| 0–9 | 589 | 0.6% | 0 | 0.0% | 0.0% |
| Source [3] | |||||
Table 3A. Covid-19 death and infection rates in Italy (3 age groups)
| Age | Cases | % of total cases | Deaths | % of total deaths |
|---|---|---|---|---|
| All ages | 94,312 | 100.0% | 10,026 | 100.0% |
| Above 60 | 51,618 | 54.86% | 9,541 | 95.21% |
| 30–59 | 37,285 | 39.63% | 478 | 4.77% |
| 0–29 | 5,185 | 5.51% | 2 | 0.02% |
Table 4. Covid-19 death and infection rates in China (9 age groups)
Data of infections and deaths is based on the first 44,672 cases reported by China as of February 11, 2020.
| Age | Cases | % of total cases | Deaths | % of total deaths |
% of death in age group |
|---|---|---|---|---|---|
| All ages | 44,672 | 100% | 1,023 | 100% | |
| Above 80 | 474 | 4.54% | 101 | 48.56% | 21.31% |
| 70-79 | 3,918 | 8.8% | 312 | 30.5% | 8.0% |
| 60-69 | 8,583 | 19.2% | 309 | 30.2% | 3.6% |
| 50-59 | 10,008 | 22.4% | 130 | 12.7% | 1.3% |
| 40-49 | 8,571 | 19.2% | 38 | 3.7% | 0.4% |
| 30-39 | 7,600 | 17.0% | 18 | 1.8% | 0.2% |
| 20-29 | 3,619 | 8.1% | 7 | 0.7% | 0.2% |
| 10-19 | 549 | 1.2% | 1 | 0.1% | 0.2% |
| 0-9 | 416 | 0.9% | 0 | 0% | 0% |
| Source: The epidemiological characteristics of an outbreak of 2019 novel coronavirus diseases (COVID-19) in China | |||||
Table 4A. Covid-19 death and infection rates in China (3 age groups)
| Age | Cases | % of total cases | Deaths | % of total deaths |
|---|---|---|---|---|
| All ages | 44,672 | 100% | 1,023 | 100% |
| Above 60 | 13,909 | 31.14% | 829 | 81.04% |
| 30–59 | 26,179 | 58.60% | 186 | 18.18% |
| 0–29 | 4,584 | 10.26% | 8 | 0.78% |
表5. Covid-19 death rates in New York (10 age groups)
Data as of April 6, 2020.
| Age | Deaths | % of total deaths | |||
|---|---|---|---|---|---|
| All Ages | 5,489 | 100% | |||
| Above 90 | 616 | 11.2% | |||
| 80–89 | 1,394 | 25.4% | |||
| 70–79 | 1,446 | 26.3% | |||
| 60–69 | 1,066 | 19.4% | |||
| 50–59 | 587 | 10.7% | |||
| 40–49 | 238 | 4.3% | |||
| 30–39 | 107 | 2.0% | |||
| 20–29 | 27 | 0.5% | |||
| 10–19 | 4 | 0.1% | |||
| 0–9 | 1 | 0% | |||
| Data source: New York Covid-19 Fatalities | |||||